Measurement, metrics and analytics
4 Min Read
If you want to improve something, start measuring it. Let’s say you want to find the root cause for depreciating Gross Transactional Value (GTV); you begin by identifying the main levers impacting GTV. However, going forward, it’s neither possible nor recommended to put all drivers to action, so it boils down to identifying the most critical factors pursuing which you get maximum impact. This is where measurement plays an integral part- it helps us measure the effect of each value driver on the overarching goal and decide the correct drivers to realize a maximum gain on your goal. It is possible that only 20% of the drivers can bring about an 80% impact on the GTV; hence, identifying that 20% becomes crucial.
Regular monitoring of metrics will help you project the future trend and pre-emptively take action when required. In a way, it minimizes the surprises along the way. Quite interestingly, this finds its application not only in attaining professional goals but also in personal ambitions. All (well, mostly) have witnessed an unsuccessful tryst with our fitness ambitions. But did you know that monitoring data can help bolster your determination and mitigate distractions? To measure your success, you need to add a metric to your goal. For example- how many days in a month did you adhere to the diet plan. Monitoring regularly helps you identify areas of lapses and provide a boost to push your limits further.
Going back to the business impact, laying down clear goals and metrics functions as a lens through which a Product Manager analyses the success of a product and is able to identify the root cause of any issue. For the context of this blog, I will refrain from going deeper and briefly cover the key metrics which need to be considered.
North Star Metric- An indicative of a company’s overall performance, reflects customer’s expectations and what the company wants to achieve i.e., Customer Lifetime × Frequency of visit per year × Number of bookings per visit × Average dollar value per booking
Core Metric- In a product lifecycle, there are multiple stages, from understanding the business requirement to monitoring the product’s utility and maintaining it. To track success, it is essential to segment the KPIs for each phase and monitor them separately. The chart below delineates the KPI for a product. This is generic but needs to be tailor-made considering the goals of the user, company and designated product.
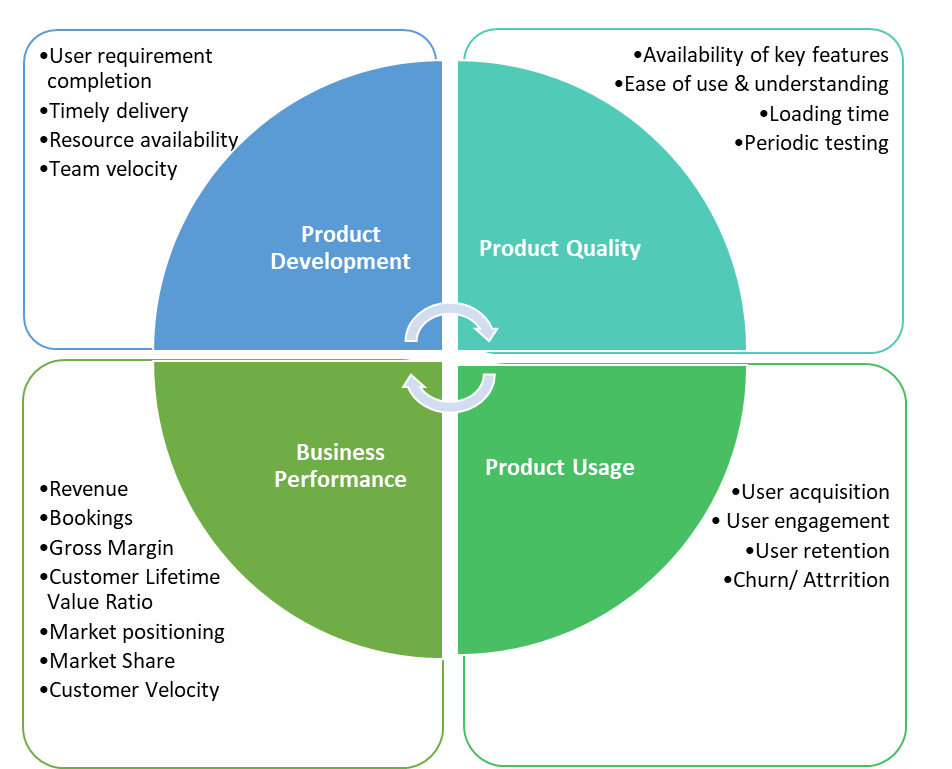
This delineates the major KPIs and further needs to be drilled down the basis of the company’s vision and growth objectives. Let’s say you are optimizing user acquisition for a startup offering a meal plan; your metrics of interest shall comprise — the number of clicks on marketing advertisements, number of downloads, number of sign-ups, and purchase of the product.
Data is indeed the fuel that elucidates the impact of all parameters and empowers us to make the right decision. Still, it’s irrefutable that deriving meaningful insights from millions of data can be daunting and tedious. Further to this, in my professional capacity, I experienced a paucity of analytical tools dedicated to B2B workspaces in the travel industry which can help them identify their competitive edge. We wanted our stakeholders to leverage the data seamlessly to get through black box questions like “right pricing model,” “sufficiency of inventory,” and “market share.”
This realization laid the foundation stone of “ TBO Dataworks,” a one-stop solution for our partners to get the actionable insights enabling them to leverage the data seamlessly. This tool monitors the trend across numerous (relevant though) driving factors and highlights the gaps if any. For example, a supplier whose maximum sales come from Jumeriah, Dubai, now gets to know their wallet share for that hotel. This gives them further insights on their relative performance for their topselling property and question why they are not selling the most in their top sold properties. Another example is identifying the top-selling destination markets and supplier’s rank in those markets. For Example, the USA was most sold in 2021, but Supplier A’s rank in it was Rank 20. This will nudge them to identify the root cause for market share movement to other suppliers and compete with the top 19.
This product also touches upon the global trend of the tourism industry to highlight the market behavior and dives specifically into the partner’s business journey, understanding the trends of their sales, booking and user preferences. One of the exciting features of this product is that data has been collated across 300+ supplier partners to bring insights into their relative performance, the share of wallet and lost potential details to understand the market share movement if any. Towards the last leg, it touches on a very important aspect of technical and operational issues to address the customer journey. Packed with data-driven insights “TBO Dataworks” is set to fuel their growth journey and scale business to new heights.
Do check out different product solutions catered to the business needs of multiple stakeholders affiliated with the travel industry here- https://www.tbo.com/tbo-dataworks