Understanding user journey through funnel analytics
5 Min Read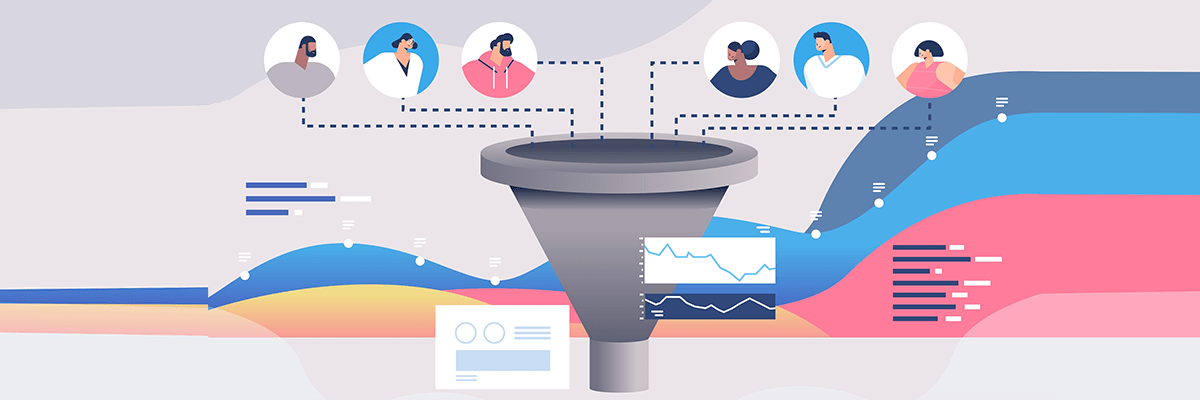
Funnel Analytics is the process to measure and analyze user journeys through customer data points and then strategizing ways to improve the overall customer engagement and experience. Funnel analytics is an aggregated customer journey process that makes it measurable and helps us identify insights and measures to retain our customers.
The value of a product may appear to be intangible, but we can always apply quantitative measurements to any product. For products like YouTube or Twitch, it may be difficult to evaluate how much users enjoy them, but we can always measure how many videos they watch daily or how much time they spent on each.
Multiple web analytics tools help us measure such values that define the success of a product. This measure could be an event, series of events, or a user behavior metric that displays users getting value out of our product. For, TBOHotel the value would be finding the right hotel and completing the booking.
Depending on the individual user, a user journey might look different, and it will look different for each product too. These journeys are designed with the use of funnels and one such web analytics tool that helps us with it is Amplitude.
What is Amplitude?
Amplitude is a self-service product analytics insight tool; it helps businesses gain insight & information from raw data and visualize it in the easiest possible way. Product, Marketing, and growth teams use it to analyze user behavior data and make decisions. Insights into user behavior help teams build new strategies that can improve user engagement, retention, and revenue.
Major features of Amplitude:
- Visualize the digital journey of users through real-time funnels.
- Gain insights into product feature with the help of event segmentation.
- Identify conversion and retention drivers for different cohorts.
- Measure and analyze customer engagement across different products.
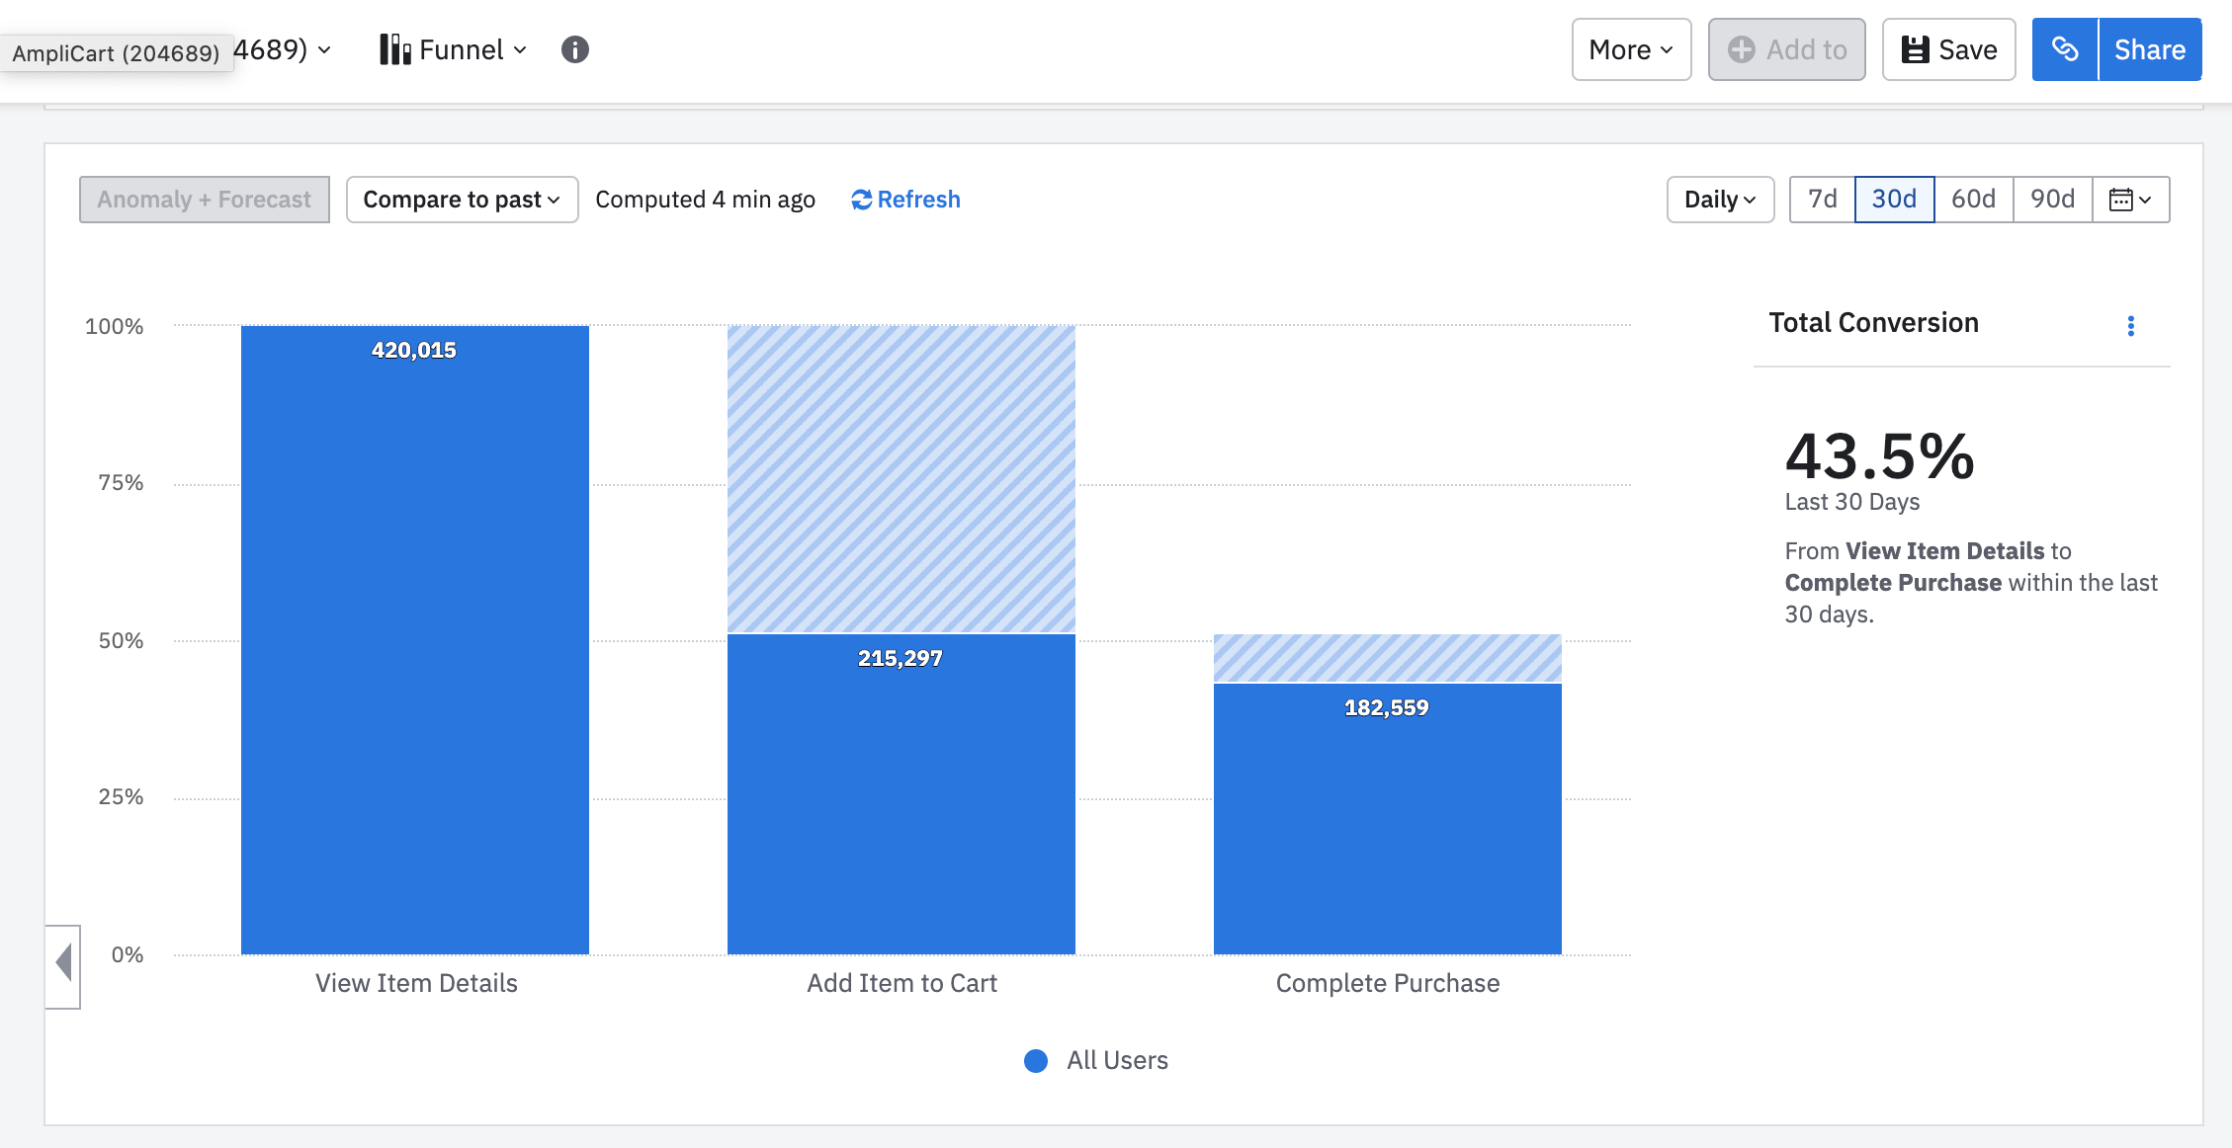
Funnel
A funnel is a series of events that a user takes which leads to a conversion. The major use case of a funnel is to identify the conversion rate which is the number of customers that performed the desired action divided by total users. It is one of the major business KPIs to track, the higher the rate the more successful is your product. Here is a look at a sample funnel for an eCommerce portal:
Funnel design
Designing a funnel mostly relies on events that we have chosen to track and the data we gather along with it. We first need to list down business questions about our users and their product usage, such questions lead to more questions which we can refer to as burning questions.
These questions could be “How many users used a car-type filter to make a booking on TBOCarRentals?” or “How many users from Dubai completed the registration process for a seminar on TBOAcademy?”
Such questions lead us to think of all the events or series of actions, a user must perform to convert or events that may show his intent to convert. We can also focus on events that would motivate more user engagement in such tasks.
All these events can then be listed in a logical order till the final conversion event to build funnels. We may come up with multiple such designs for a single conversion event helping us answer all our burning questions. We can come up with multiple hypotheses and then with the help of funnels bring them to life and test them.
While designing a funnel with web analytics data we can always refer to the AIDA model of the sales funnel. This model has four steps: Awareness, Interest, Desire & Action
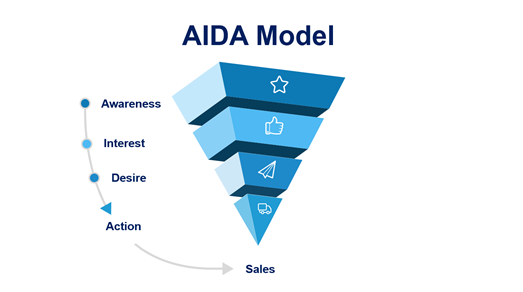
Awareness: This is the first stage where a user knows about your product, for our TBOHotel portal it could be when a user lands on its search page.
Interest: This is when a user starts interacting with our product and identifies the value of our product, On TBOHotel it is when a user searches for a destination.
Desire: This is when a user has experienced the value of our product and intends to convert, On TBOHotel it is when a user has found the right hotel at the right price on the results page.
Action: The last step where users convert, which could be a sale or subscribing to a product. On TBOHotel, it is when a user finally makes a booking.
Event properties & Cohorts
Once we visualize a funnel, it’s also very important to focus on the event property to define the event precisely helping us analyze our funnels more efficiently. We can also develop different cohorts/groups of users and then further analyze the funnel for the respective group of users.
Funnel measurement
Once we have our basic funnel design setup and identified the user segment, we want to observe in these funnels then we focus on how to interpret funnel data and metrics. We can do it in 4 different ways:
Conversion: This is the most used measure for a funnel where we can see overall conversion and step-by-step conversion. It also helps us in identifying the major drop-off points for our users and in case there is a major drop-off of users during one step of the funnel then we can center our efforts on it.
Conversion over time: This is a very important scale as it helps us to view the seasonality effect on specific funnels. We are in the travel business, and this helps us understand the seasonality effect of different source markets on different funnels.
Time to convert: Time is always an important conversion factor, and the efficiency of a website can be measured by how fast a user finds what he/she is looking for. All major eCommerce companies try to reduce the number of friction points between login and sale, thus reducing the time to convert.
Frequency: A user may perform an event multiple times before moving ahead to the next step, which displays repetitive behavior. This measure helps us identify the number of users doing it in each funnel.
All these measures help us ask the right questions and look at them from different angles. Once we can understand them then we can build on innovative hypotheses and find ways to overcome the challenges.
Benefits of Funnels:
Improve conversion: We develop our hypotheses on the user journey and then try and understand through funnels what users do or don’t do while interacting with our product.
We can develop A/B tests and experiments for different segments to test our hypothesis to improve user engagement & experience. Based on these tests & experiments we can further make UI changes at various steps to see how they affect the conversion rate.
Optimize Customer lifetime value: Customer lifetime value helps us understand how much business value each customer generates and being a B2B organization we need to understand our Agents and ways to retain them.
The process to acquire and convert is critical in ensuring consistent growth in CLV and user base, Funnels help us to ensure that they are as effective as possible.
Identifying key drivers of conversion: Funnel design is an important step but once we have our funnel the next step is to go beyond basic funnel analysis and bifurcate it based on different user behavior or characteristics. This helps us understand which segment is most likely to convert.
Funnels and web analytics tools like Amplitude can help us combine marketing analytics with product analytics. Marketing analytics help us answer questions like how many viewed the page, where did they come from, and did they make a purchase. Product analytics on the other hand helps us answer where did the user drop off, and what was the impact of a launch of a new feature.
Funnels thus give us a holistic view of acquisition, engagement & retention. They help us make decisions based on numbers projected by web analytics data and not assumptions. It helps us to track multiple product metrics and understand user behavior deeply.